


Full report | 11,066 vehicles where stolen in NZ in 2022

All the information in this page was checked by:

We put every effort into ensuring information on Finder is accurate. Double-check details that matter to you before applying or buying.
The Mazda Demio tops the stolen vehicles list, NZ, with 1 in every 10.2 stolen cars being this model. The rest of the top 10 most stolen cars in 2022 are the Mazda Atenza, Nissan Tiida, Subaru Legacy, Mazda Familia, Subaru Impreza, Toyota Hilux, Ford Courier, Subaru Forester, and Honda Civic.
Do you own either of these cars? Find out which area of Auckland has had over 1,100 carjackings in 2022.
Odds of car theft in New Zealand Infographic
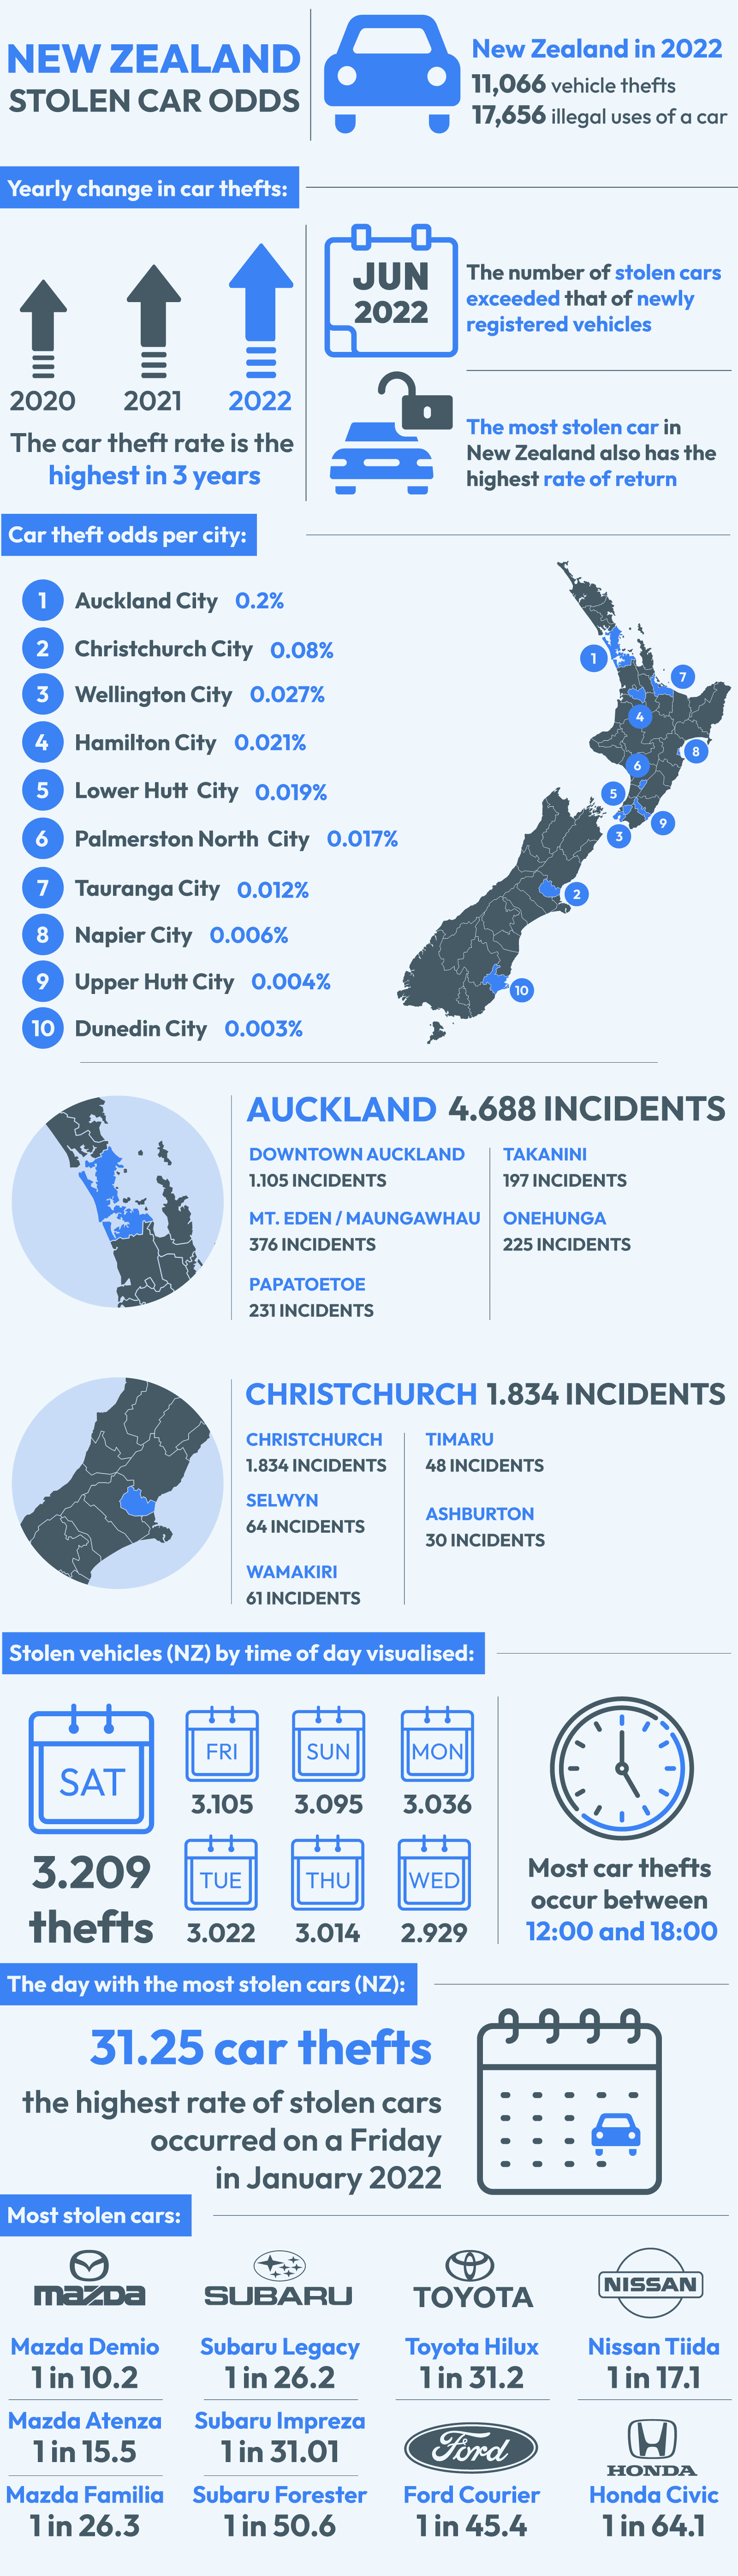
What are the odds of your car getting stolen in your city?
| City / District | Odds of a carjacking occurring | Share of total carjackings |
|---|---|---|
| Auckland | 0.211402% | 1 in 2.34174 |
| Christchurch City | 0.083224% | 1 in 5.948426 |
| Wellington City | 0.027289% | 1 in 18.14073 |
| Hamilton City | 0.021868% | 1 in 22.63843 |
| Lower Hutt City | 0.019202% | 1 in 25.78118 |
| Palmerston North City | 0.017214% | 1 in 28.75853 |
| Tauranga City | 0.01256% | 1 in 39.41367 |
| Napier City | 0.006461% | 1 in 76.62238 |
| Hastings District | 0.00628% | 1 in 78.82734 |
| Whangarei District | 0.006054% | 1 in 81.76866 |
| Rotorua District | 0.004744% | 1 in 104.3524 |
| Upper Hutt City | 0.004563% | 1 in 108.4851 |
| Wanganui District | 0.004337% | 1 in 114.1354 |
| Kapiti Coast District | 0.00384% | 1 in 128.9059 |
| Dunedin City | 0.003569% | 1 in 138.6962 |
| New Plymouth District | 0.003479% | 1 in 142.2987 |
| Porirua City | 0.003479% | 1 in 142.2987 |
| Far North District | 0.003298% | 1 in 150.0959 |
| Selwyn District | 0.002982% | 1 in 166.0152 |
| Invercargill City | 0.002982% | 1 in 166.0152 |
| Waikato District | 0.002846% | 1 in 173.9206 |
| Taupo District | 0.002846% | 1 in 173.9206 |
| Waimakariri District | 0.002666% | 1 in 185.7119 |
| Nelson City | 0.00253% | 1 in 195.6607 |
Top 10 most stolen cars in NZ for 2022
| Car type | Percentage of stolen cars NZ | Odds of all stolen cars being the model |
|---|---|---|
| Mazda Demio | 9.8% | 1 in 10.2 |
| Mazda Atenza / Mazda 6 | 6.45% | 1 in 15.5 |
| Nissan Tiida | 5.834% | 1 in 17.141 |
| Subaru Legacy | 3.817% | 1 in 26.2 |
| Mazda Familia | 3.8% | 1 in 26.32 |
| Subaru Impreza | 3.225% | 1 in 31.01 |
| Toyota Hilux | 3.2% | 1 in 31.25 |
| Ford Courier | 2.2% | 1 in 45.45 |
| Subaru Forester | 1.975% | 1 in 50.63 |
| Honda Civic | 1.558% | 1 in 64.185 |
Source and limits on data
Our statistics on the top 10 most stolen cars of NZ, in 2022, come from the data published by AMI, a New Zealander trusted insurer. The figures relate to the 12,000 vehicle theft reports the company received for the past year.
Most easily recovered stolen vehicles list, NZ
Although the Mazda Demio tops the stolen vehicles list, NZ insurer AMI also reports that the car type has also been the most easily recovered.
Stolen Demios had a 94% rate of recovery across New Zealand. This contrasts with the 70% average for returned cars across all models.
The poorest recovery rates were met for the Toyota Hilux, with only 30% of the cars being returned to their owner.
The second poorest rate for NZ most stolen cars was for the Ford Courier, with 47% of the vehicles being recovered.
Is it a risk to own the most stolen car in NZ?
According to current most stolen cars NZ stats and a recent case presented by the Otago Daily Times, there could be.
However, Demio owners should also account for the success rates in recovering the model.
There is a clear increased risk of losing the car, but you will likely have it returned, granted, with damage and an empty gas tank.
What do the most stolen cars in NZ have in common?
Almost all models listed on the most stolen vehicles list NZ are generally older than 20 years, with the Atenza being the only model launched in 2004.
Their age comes with a more rudimentary security system. For instance, the Demio only received an immobiliser in 2014, with previous models being built without one. However, they all still lack an alarm.
No factory-built immobiliser is maybe what the top 10 stolen vehicles in NZ 2022 all have in common. The absence of theft deterrent systems makes these cars ideal targets.
Additionally, several models from the NZ most stolen cars list are some of the most common vehicles in the country. And those that are popular but rarely get stolen generally have newer security systems.
Most common car in NZ
- Ford Ranger
- Toyota Hilux
- Mitsubishi Outlander
- Toyota RAV4
- Mitsubishi ASX
- Mitsubishi Triton
- Toyota Corolla
- Nissan Navara
- Tesla Model 3
- Mazda CX-5
Carjacking odds, based on region
| Regions | Probability of car theft | Odds of a car being stolen |
|---|---|---|
| Northland | 0.003387 | 1 in 295.21 |
| Auckland | 0.005733 | 1 in 174.42 |
| Waikato | 0.003243 | 1 in 308.34 |
| Bay of Plenty | 0.004374 | 1 in 228.60 |
| Gisborne | 0.005702 | 1 in 175.38 |
| Hawke’s Bay | 0.005408 | 1 in 184.91 |
| Taranaki | 0.002834 | 1 in 352.85 |
| Manawatu-Whanganui | 0.005261 | 1 in 190.09 |
| Wellington | 0.005806 | 1 in 172.23 |
| Nelson-Marlborough | 0.001764 | 1 in 556.78 |
| Canterbury | 0.004713 | 1 in 212.19 |
| West Coast | 0.001637 | 1 in 610.91 |
| Otago | 0.0015 | 1 in 666.50 |
| Southland | 0.001971 | 1 in 507.32 |
| Area Outside Territorial Authority | 0.000466 | 1 in 2,147.75 |
| New Zealand avg. | 0.004548 | 1 in 219.89 |
Date of stolen vehicles list NZ
The presented data is based on the most recent governmental annual reports on the national fleet. We have computed the exact probabilities and odds based on the stolen and owned cars in 2020.
Stolen cars key facts

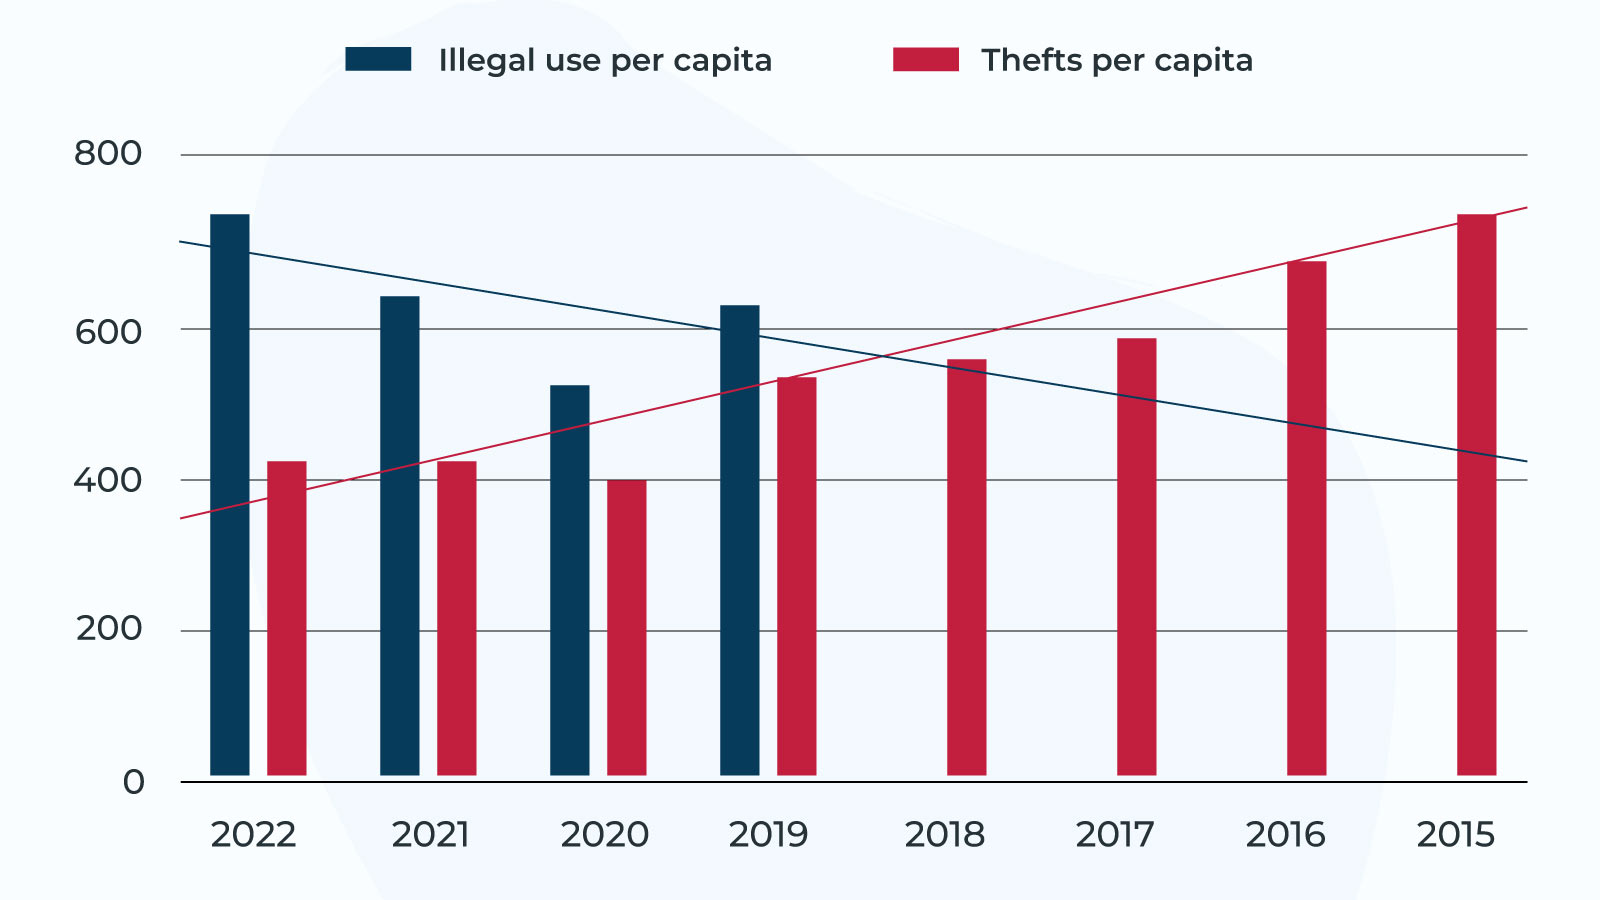
- According to the stolen vehicles NZ statistics, there were 11,066 vehicle thefts and 17,656 illegal uses of a car in 2022.
- The current trend indicates an increase in NZ stolen cars from 2021.
- The stolen cars NZ rate of 2022 is the highest in three years, with the 2019 rate surpassing it.
- In June 2022, the stolen cars NZ numbers exceeded newly registered vehicles nationwide.
- Considering the risk of being a victim of carjacking, Auckland is still the worst area to reside in, having seen 4,688 incidents.
- The capital’s downtown alone has seen 1,105 cases, being the worst hotspot in car crime density.
- As for the city with the second most stolen cars, Christchurch keeps its place with 1,834 cases.
- Officials have identified the lack of built-in immobilisers as a commonality between these models and a possible cause for high car theft statistics NZ rates.
- The most stolen vehicle has also been the most returned car following a carjacking, with a recovery rate of 94%.
- According to car theft statistics, NZ vehicular crimes occur in the afternoon and during weekdays.
- For the most stolen cars, NZ saw its worst day on a Sunday in December 2019, with an estimated 34.75 cars stolen or stolen from.
- For this year’s most stolen cars, NZ 2022 peaked on a Friday in January 2022, with approximately 31.25 vehicles implicated daily.
Stolen vehicles
According to the stolen cars NZ records for this year, there have been 28,613 related offences within the first six months, with 11,066 car thefts.
The exclusive stolen vehicles NZ figures from the first six months of 2022 would result in a projected 1116.14 per 100,000 population rate of related crimes, with 431.667 per 100,000 population being exclusively reported thefts.
As for stolen vehicles, NZ police databases currently list 4885 open cases.
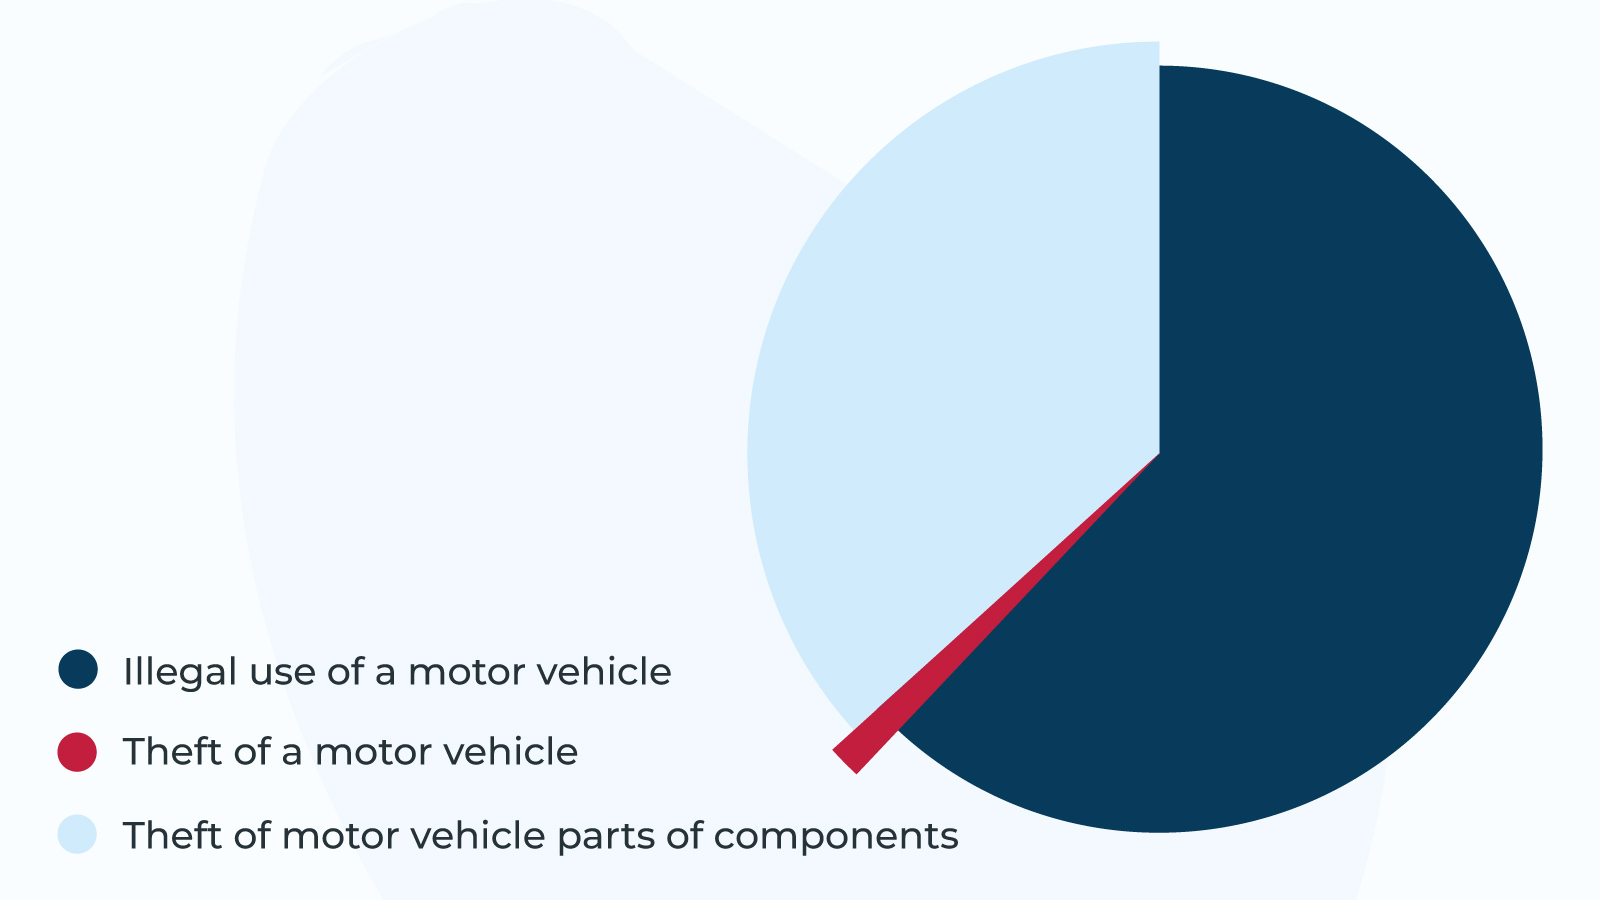
Breakdown of stolen cars NZ data
- Illegal use of a motor vehicle – 17,656
- Theft of a motor vehicle – 60
- Theft of motor vehicle parts or components – 10,897
Stolen vehicles NZ figures visualised
Comparison with most stolen cars, NZ 2021
The 2022 projected figures indicate 3.977 more counts in stolen parts and stolen vehicles NZ cases, with 51.91 illegal vehicle usage cases, per 100,000 citizens.
Thus, relative to last year’s reported cases, New Zealand would be set to see an increase of 0.0182% in thefts and a 0.1592% decrease in the use of illegal motor vehicles.
NZ stolen cars and related offences in 2021
In 2021, there were 21,909 car theft cases, with an additional 32,607 counts of illegal use of motor vehicles, according to reports.
Stolen vehicles NZ cases amounted to 427.69 per 100,000 population, while all related incidents resulted in 1064.23 counts per 100,000 population.
How many cars in NZ get stolen
-
Compared to yearly registrations
There were 27,317 car registrations in New Zealand from the beginning of 2022. The entirety of motor vehicle offences surpasses the number of registrations within the same year.
NZ stolen cars and car parts alone amount to 40.51% of the reported registrations.
-
Compared to unit sales
The country saw car sales of 56,361 units in 2022, with the rates of stolen vehicles NZ faced making up approximately 19.634%.
Comparatively, in 2021, New Zealanders bought 111,783 vehicles across the twelve months, with theft cases of the year amounting to 19.5996%.
2022 is estimated to see more cars bought and stolen, but the increase in relative rates is only marginal.
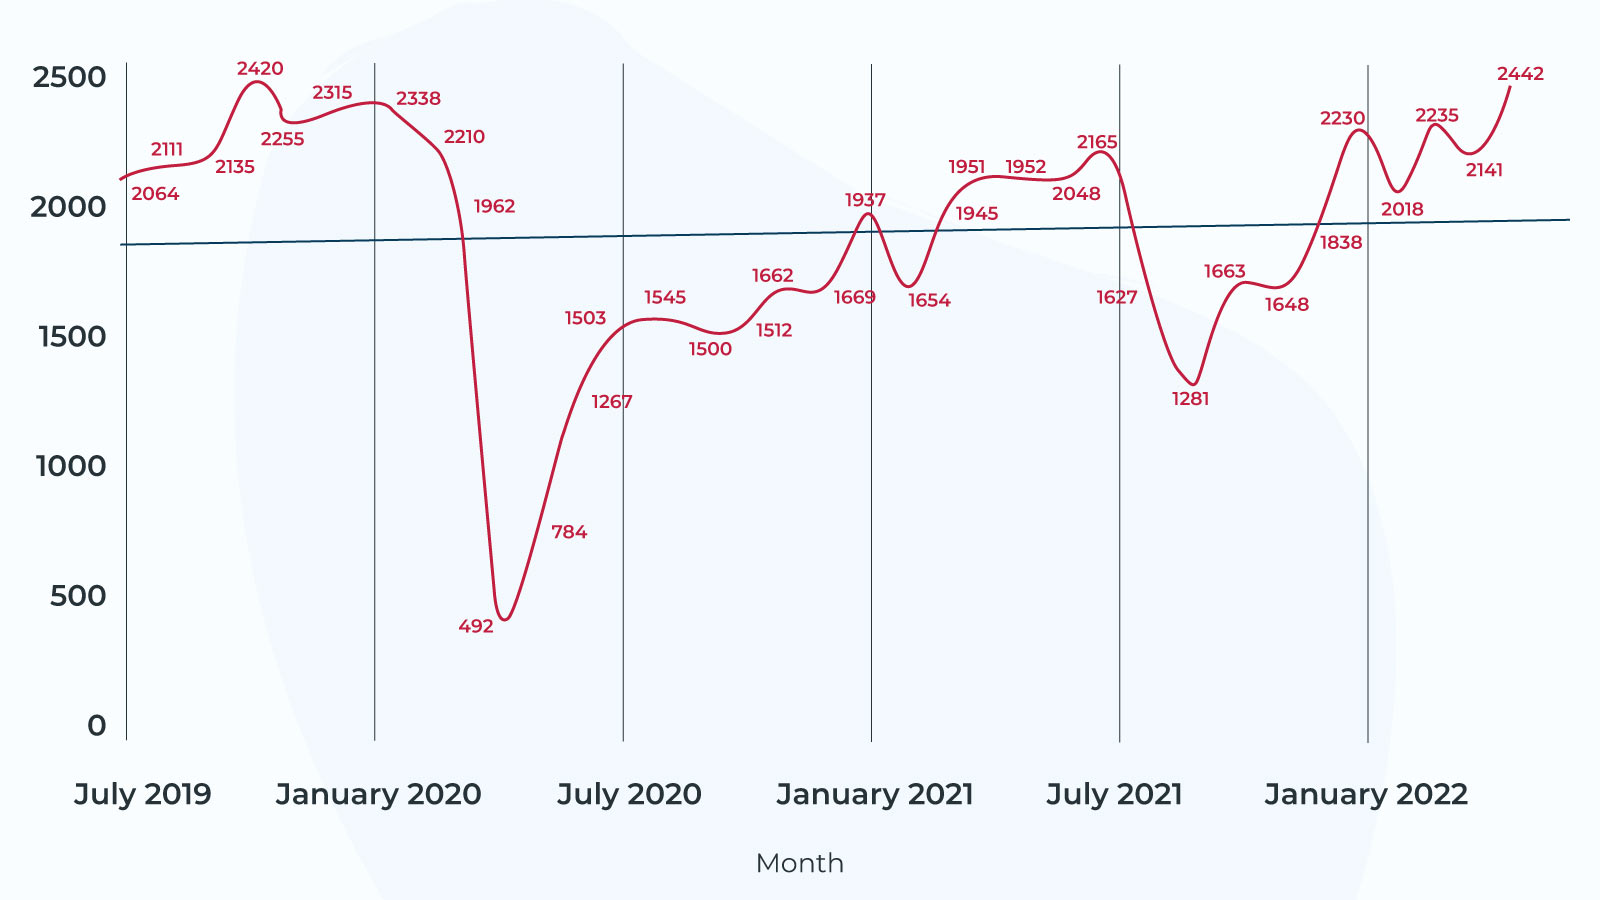
Registered vs stolen cars NZ (Jul. 2021 – May 2022)
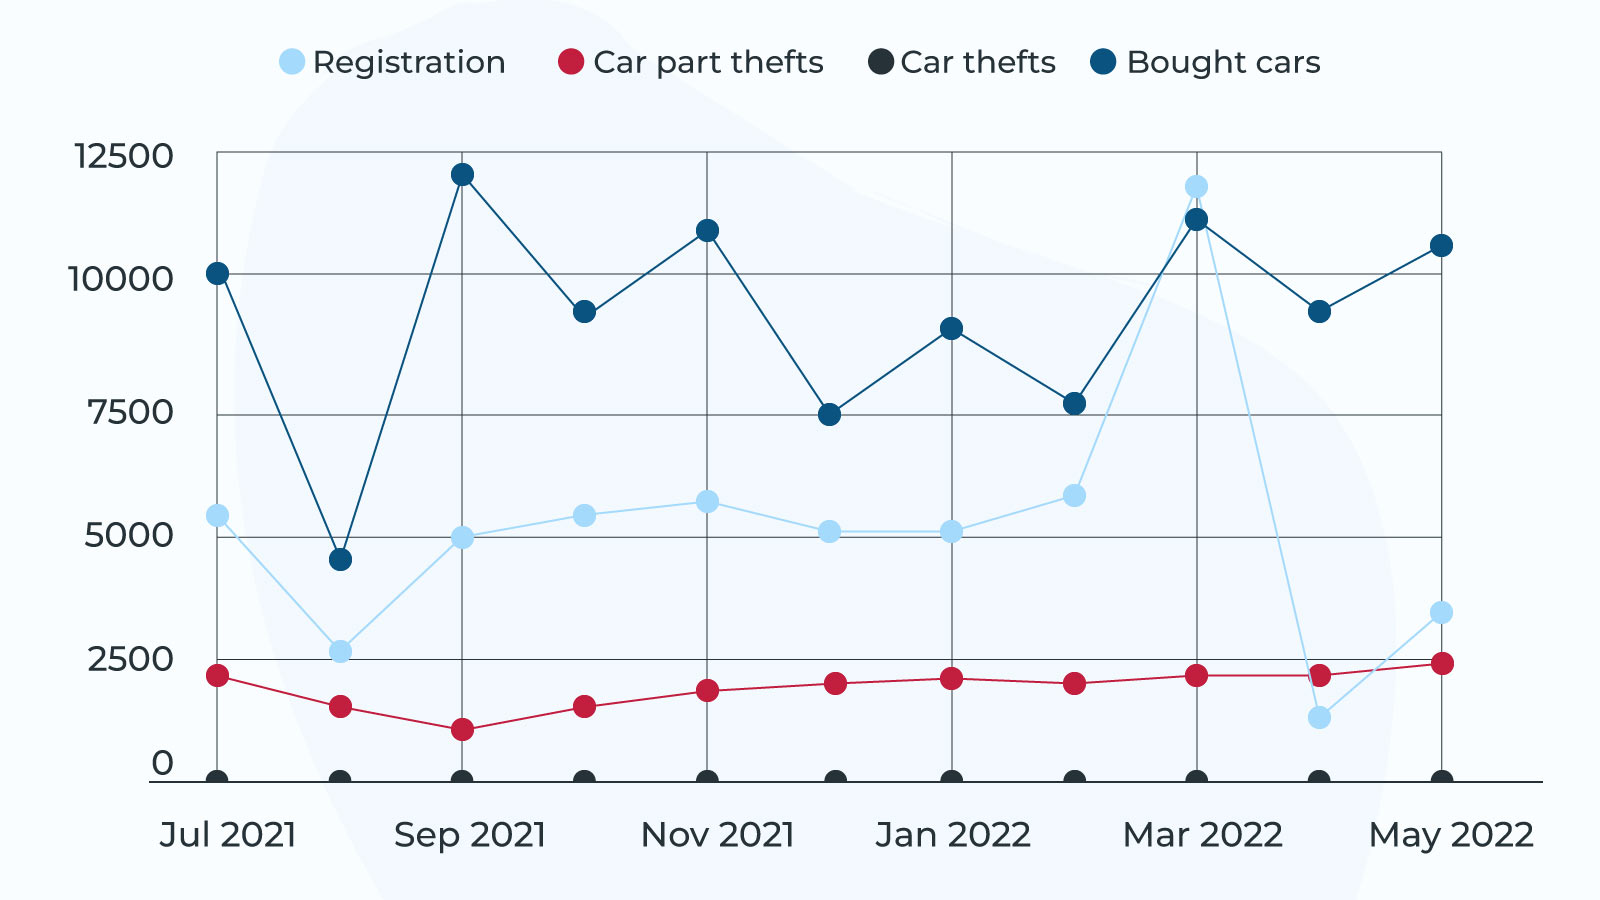
On average, the number of stolen cars NZ cases made up 37.413% of the registered vehicles and around 21% of bought cars per month.
April was the only month in the year when the number of registrations fell under the number of reported vehicular thefts (including car part thefts).
NZ stolen vehicles to owned vehicles ratio
With 4,431,860 million reported cars in New Zealand in 2021, 1 in every 202.3 vehicles were stolen or broken into during the year.
In 2020, New Zealanders owned 3,363,669 cars, with 1 in 150.03 being stolen. Finally, in 2019, there were a reported 4,330,784 owned cars, resulting in 1 in 143.2 vehicles being stolen or broken into.
The car theft rates are slowly decreasing relative to the total number of cars. However, this trend is also a consequence of the upwards swing in units bought by New Zealanders.
Stolen cars by year in New Zealand
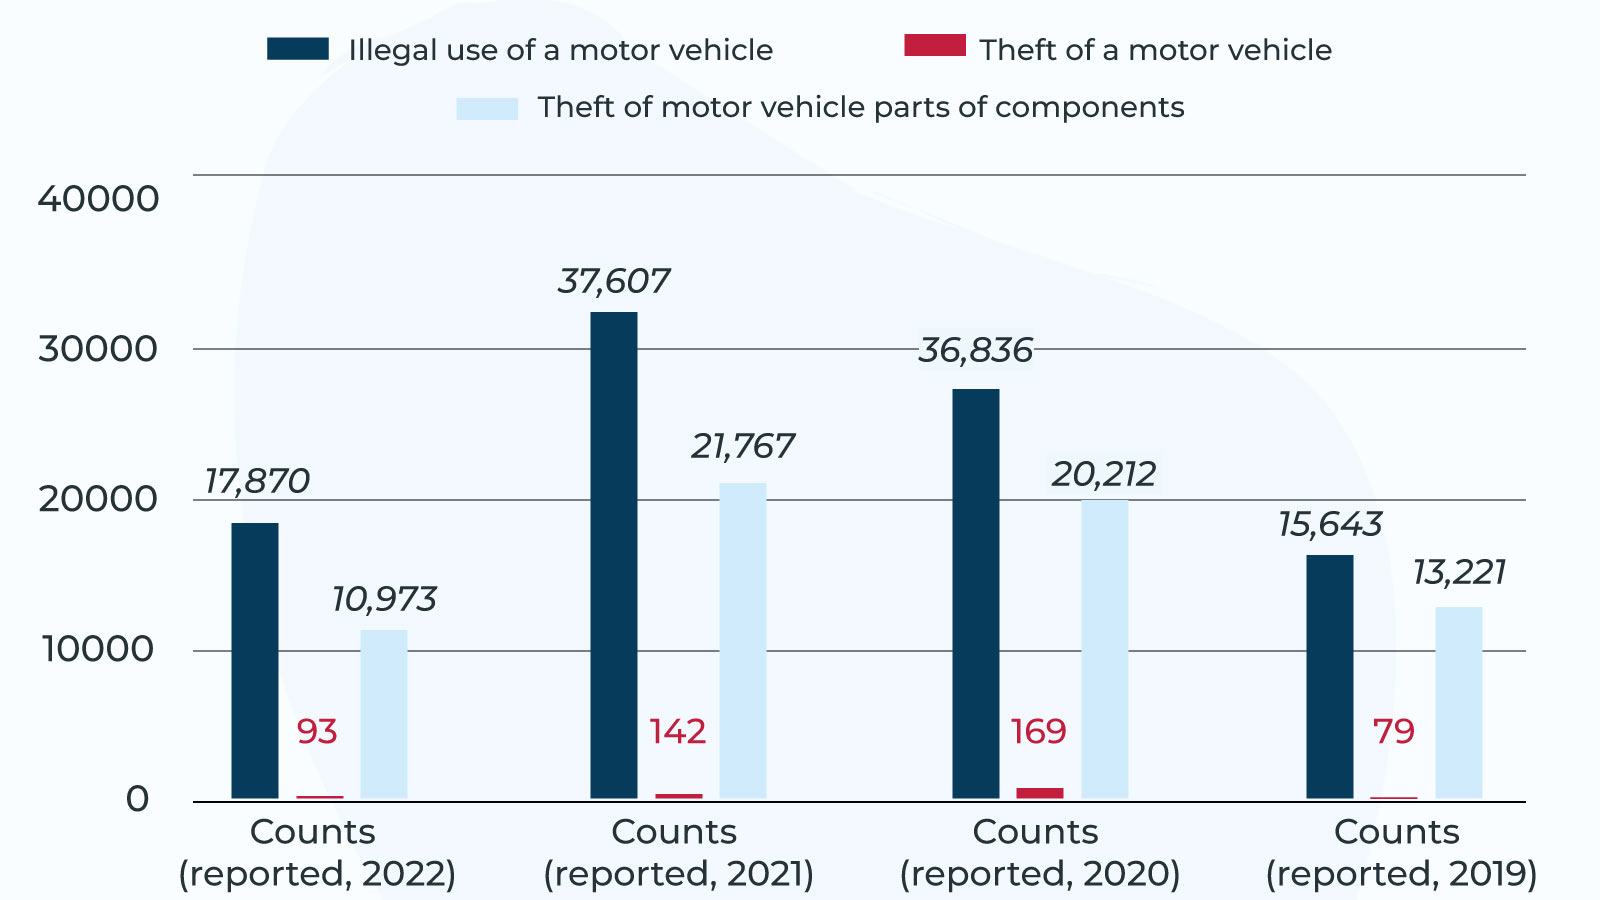
Partial data
The data for 2022 includes reports from January to May, while those for 2019 go from July to the end of the year. Considering these values to be descriptive of the entire year is misleading.
Per capita illegal vehicular use and stolen cars NZ
Most stolen cars by region
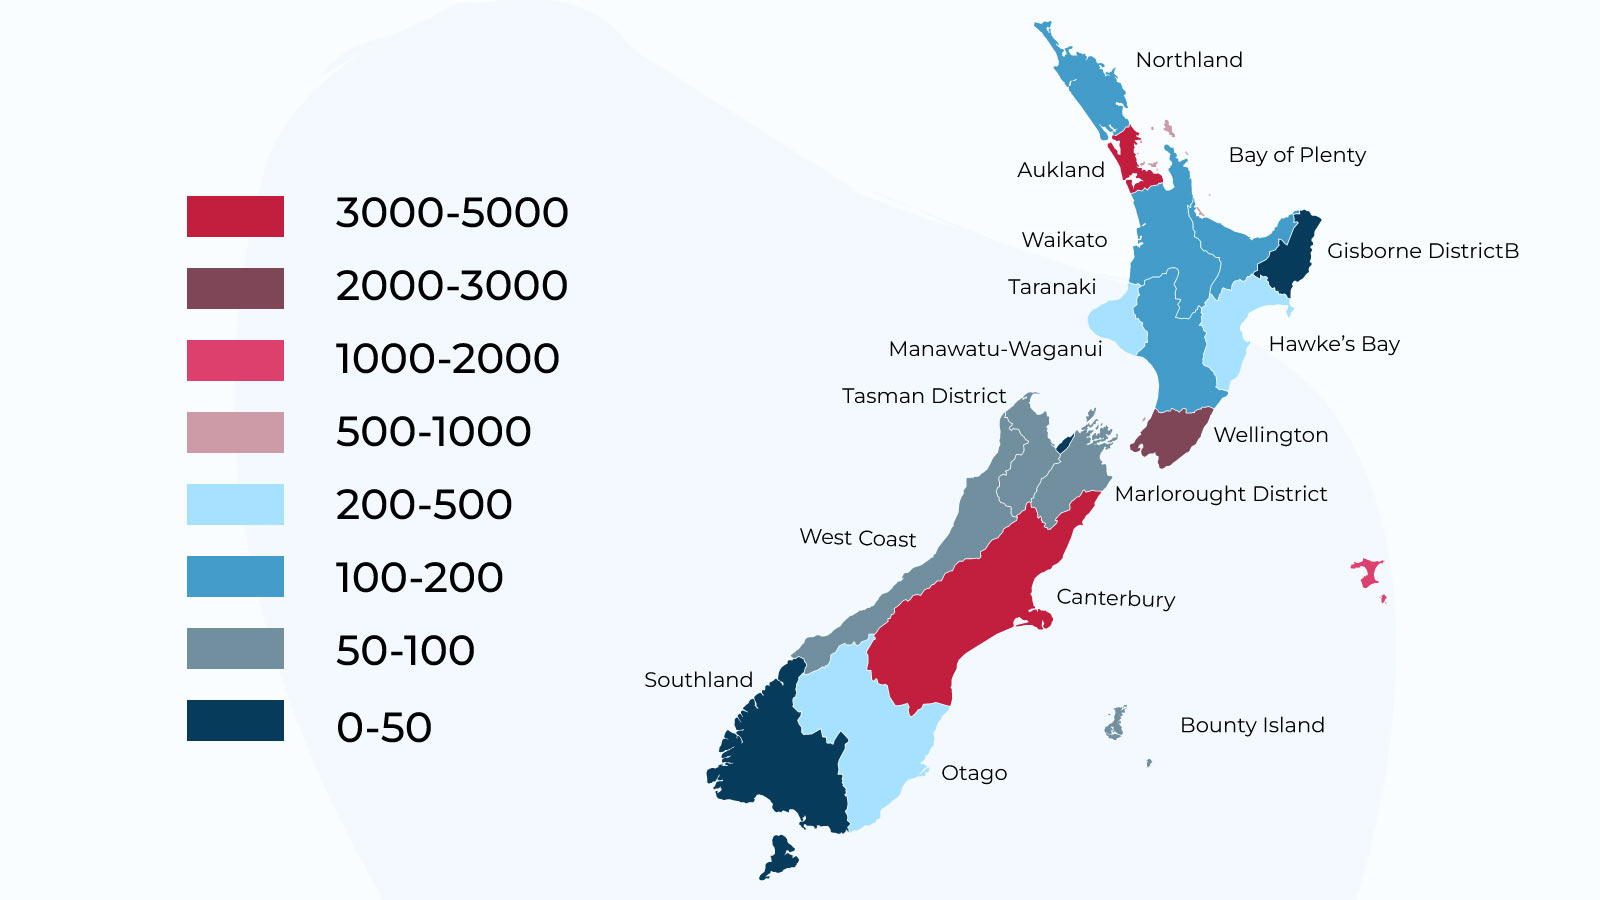
Does living in an area with more stolen cars in NZ mean that you will fall victim to the same type of crime? Not necessarily.
Like in the case of other infrequent but eyebrow-raising events, such as New Zealander’s odds of being bitten by a shark, a slightly higher rate of occurrence raises the likelihood, but it does not mean that you are at real risk.
Statistics can be misleading. That’s why it is essential to listen to experts and understand the context behind the data. Nonetheless, you can still aim to be vigilant, which is why we share the presented data.
Carjacking: Auckland
Auckland City is the current leader in stolen cars NZ statistics, with 4,688 cases that currently amount to 42.7% of all reported thefts.
Riskiest areas for car crime and carjacking: Auckland
| Locations | Cases |
|---|---|
| Downtown Auckland | 1,105 |
| Papatoetoe | 231 |
| Maungawhau / Mt Eden | 376 |
| Onehunga | 225 |
| Takanini | 197 |
| Epsom | 181 |
| Balmoral | 169 |
| Mangere | 167 |
| Donegal Park, Ormiston | 159 |
| Hillsborough | 142 |
| Mount Wellington | 136 |
| Parnell | 136 |
| Newmarket | 128 |
| Sandringham | 128 |
| Albany | 122 |
| Manukau | 118 |
| LynnMall | 103 |
Stolen cars: Christchurch
Christchurch is the second riskiest hotspot according to car theft statistics (NZ, 2022), having had 1,834 cases or 16.7% of the total.
Additionally, the Canterbury region remains the second region by reported cases, with 2,084 counts or 19% of all incidents.
Stolen cars: Christchurch and Canterbury region
| Districts | Cases |
|---|---|
| Christchurch City | 1,834 |
| Selwyn | 64 |
| Waimakariri | 61 |
| Timaru | 48 |
| Ashburton | 30 |
| Waitaki | 25 |
| Hurunui | 11 |
| Waimate | 4 |
| Mackenzie | 4 |
| Kaikoura | 3 |
When do most carjackings occur?
Most stolen vehicles NZ cases happened in broad daylight, with a spike of car-related criminality occurring between 12 PM and 6 PM.
The safest times for car owners are between 9 PM and 6 AM. Immediately after, the cases experience an escalation that later turns into a surge.
According to police reports, Monday has been the day with the highest number of car thefts, with Friday coming in second and Saturday being a close third.
Wednesday has been the safest day of this year, with Thursday showing a shoot-up in cases that then turns even more vertiginous following Friday. Sunday, on the other hand, has been relatively uneventful.
NZ: stolen cars by time of day
| Hour intervals | Jan 2022 – May 2022 | May 2021 – May 2022 | May 2020 – May 2022 | Jul 2019 – May 2022 |
|---|---|---|---|---|
| 00:00 – 02:59 | 277 | 589 | 981 | 1,365 |
| 03:00 – 05:59 | 245 | 567 | 909 | 1,213 |
| 06:00 – 08:59 | 381 | 752 | 1,215 | 1,696 |
| 09:00 – 11:59 | 602 | 1,298 | 2,360 | 3,469 |
| 12:00 – 14:59 | 697 | 1,591 | 2,931 | 4,358 |
| 15:00 – 17:59 | 704 | 1,535 | 2,775 | 4,198 |
| 18:00 – 20:59 | 587 | 1,282 | 2,257 | 3,262 |
| 21:00 – 23:59 | 332 | 715 | 1,264 | 1,849 |
Stolen vehicles (NZ) by time of day visualised
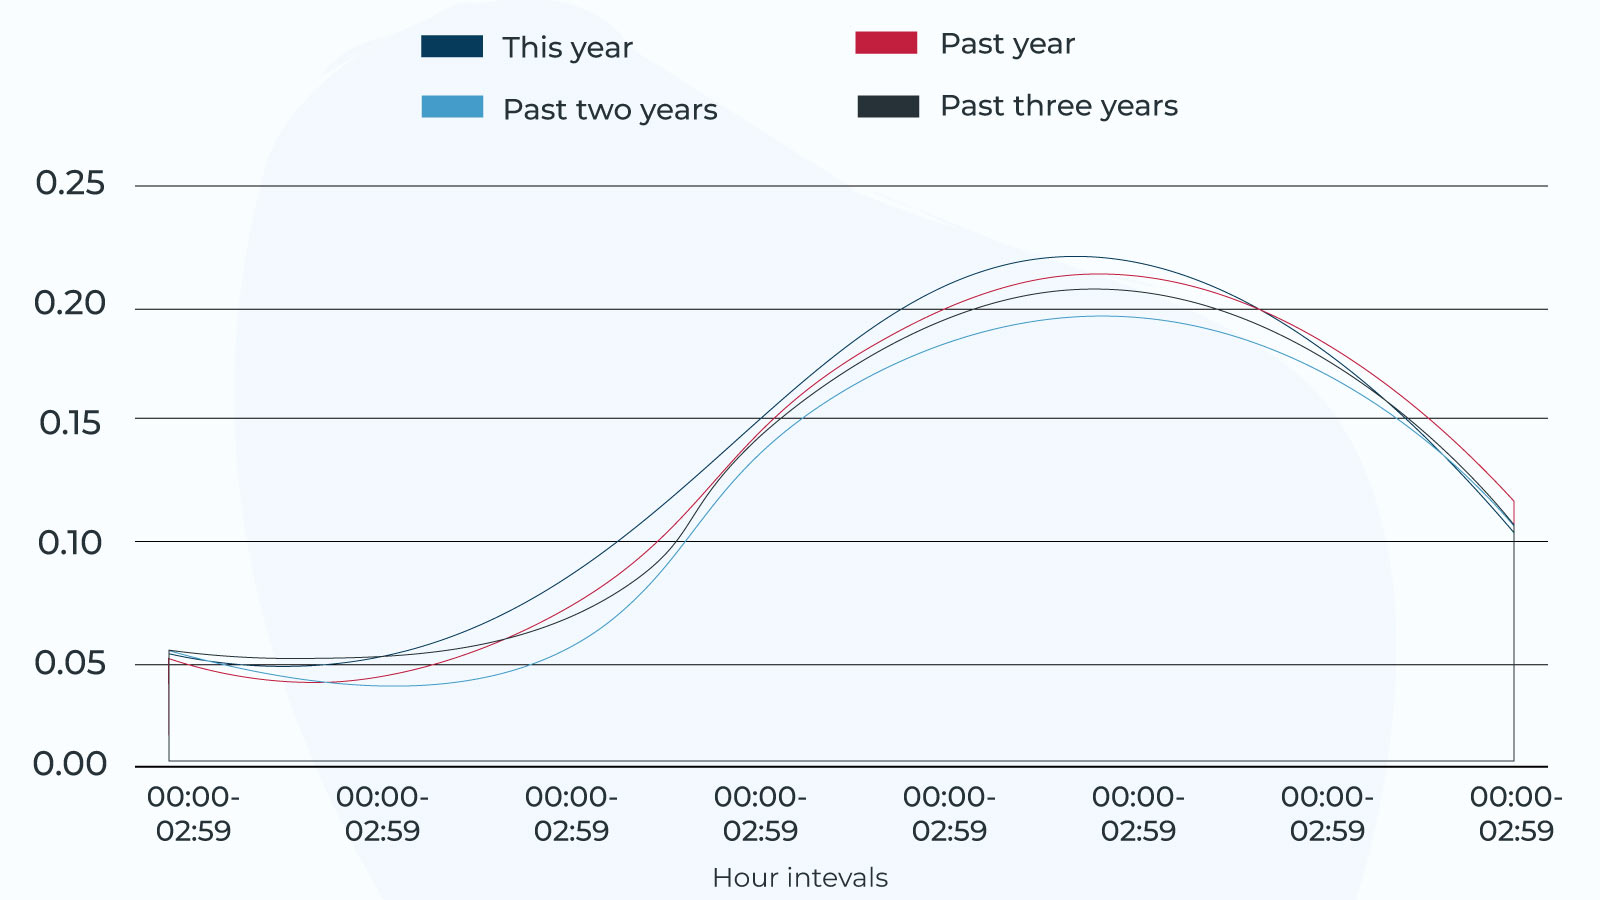
The trends of this year are confirmed by those from past years.
The highest case rate of stolen vehicles NZ police reported has occurred in the midday-afternoon interval, with rates falling during nighttime.
NZ: stolen cars by weekday
| Days | Jan 2022 – May 2022 | May 2021 – May 2022 | May 2020 – May 2022 | Jul 2019 – May 2022 |
|---|---|---|---|---|
| Sunday | 519 | 1,159 | 2,090 | 3,095 |
| Monday | 584 | 1,183 | 2,089 | 3,036 |
| Tuesday | 540 | 1,185 | 2,107 | 3,022 |
| Wednesday | 500 | 1,130 | 2,007 | 2,929 |
| Thursday | 523 | 1,164 | 2,039 | 3,014 |
| Friday | 581 | 1,221 | 2,133 | 3,105 |
| Saturday | 578 | 1,287 | 2,227 | 3,209 |
Stolen vehicles (NZ) by weekday visualised
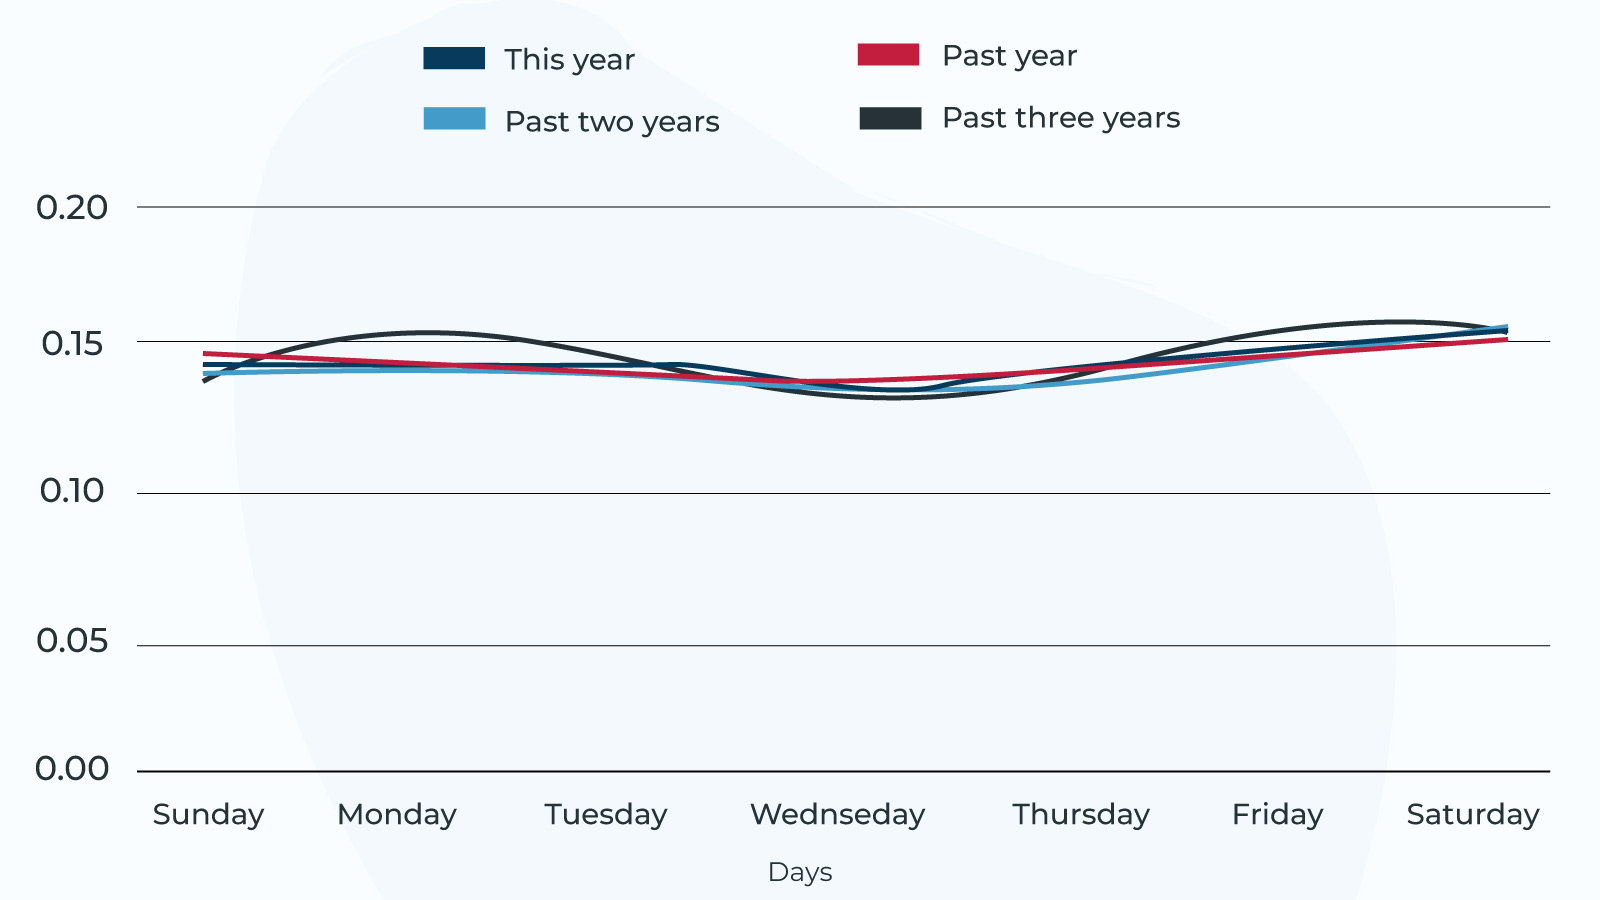
While the 2022 variation was notable, albeit minimal, the trend of past years would indicate no considerable difference between days in matters of risk, except for Saturday, which historically was the day with most NZ car thefts.
Nevertheless, Wednesday has been the safest time of the week for multiple years.
Stolen cars NZ by month
The day with most stolen cars
Judging by the stolen cars NZ statistics published by the police, we can expect the day with most car thefts to have occurred on a Monday in May 2022.
The authorities have reported that, during the month, there were 153 car or car part thefts on Mondays. There were five Mondays during May 2022. Thus, there was an average of 30.6 such events per day.
We can further speculate that the time with most stolen vehicles in New Zealand was between 9:00 and 12:00 or 18:00 and 21:00. So the maximum rate of occurrences on the Mondays of May 2022 would be either 2.1(3) or 2.2(6) car thefts per hour.
The second likeliest day with the most stolen cars in NZ was Tuesday or Wednesday in October 2019, with an approximate count of 25.4-25.8 thefts per day.
What is the day with the most stolen cars in NZ reports?
The month with the highest number of vehicular thefts per day is one Sunday of October 2019, with 34.75 stolen cars per day.
Our previous estimations showed an expected result for most thefts per day. However, the stolen cars NZ reports have outliers, like the December 2019 Sundays, that get lost as statistical fuzz.
Days with most stolen cars, NZ statistical outliers included
| Day | Month and year | Theft rate per day |
|---|---|---|
| Sunday | December 2019 | 34.75 |
| Saturday | February 2020 | 34.5 |
| Friday | February 2020 | 32.75 |
| Saturday | January 2020 | 32.25 |
| Friday | November 2019 | 32 |
| Monday | December 2019 | 32 |
| Friday | January 2022 | 31.25 |
| Saturday | May 2021 | 30.75 |
| Saturday | January 2022 | 30.6 |
| Sunday | March 2022 | 30.5 |
| Friday | January 2022 | 30.25 |
| Monday | May 2022 | 27.5 |
Locations with most potential carjackings
When it comes to stolen vehicles, NZ regions and localities are not as decisive as the actual location you leave your car in.
There is no decisive report on the premises of most carjackings, since compiling the data comes with several hurdles. In NZ, most stolen cars disappear in daylight and during workdays, but it often occurs without any witness. Additionally, premises are difficult to compare and causally tie to the actual theft.
However, there are some general guidelines regarding the locations frequently targeted by criminals.
Public parking lots are one target for car crime
Most public parking lots have their fair share of security systems and measures. However, these do not provide the same protection to all areas, due to the sheer size of such a premise.
This variation coupled with the number of potentially undefended vehicles makes parking lots a hotspot for car thefts. Most incidents occur around commercial facilities, like malls, or supermarkets. However, leisure venue parking lots can also be a target.
A recent case from Australia showcases that even lavish and top-tier locations, such as the Melbourne Crown Casino, where the parking valet mistakenly returned the key to a thief.
Such occurrences prompt more and more consumers to renounce physical shopping or leisure, if possible opting to use remote services, such as food or groceries delivery services, on-demand media, or New Zealand online casinos, considering the latter case. These services often facilitate streamlined and convenient services, either for a price or for free, such as our last example.
Dark and hidden areas are the most dangerous
In the case of surface-level parking lots, the further your vehicle is from the entrance, the higher the risk of it getting stolen. If it is additionally placed on the outskirts of the premise, or in the security cameras’ blind spots, it is even worse.
Reports also confirm that public parking garages are also prime targets, due to them being confined spaces with many blindspots and insufficient security staff.
This goes further, with risks extending to parking on the street, even in supposedly well-off areas. As a rule of thumb, if your car is easily accessible by strangers, and out of security systems’ or your sight, it is poorly placed.
Where and how to leave your car
Always place your vehicle in front of an obstacle if possible. This makes it harder for thieves to tow or leave with it.
Naturally, placing it within seeing distance is key, but if you have no choice, leave it in places that have CCTV cameras installed. One more essential insight: how you park is crucial for your car’s safety.
You should naturally never leave your vehicle unlocked or with rolled-down windows. However, you can additionally secure it by turning your wheels towards the curb and blocking the steering wheel. This way, criminals have no chance to tow it and may botch the theft attempt, too.
How to protect your car

You now know the stolen cars NZ statistics and facts. Being a victim of vehicular theft is a valid concern for New Zealanders.
We will share some basic methods of protecting your car from making it into the statistics of the most stolen cars in NZ.
-
Purchase and install anti-theft devices
The longer it takes for a criminal to steal your vehicle, the higher the chances they are caught and apprehended.
More than prolonging the time of the crime and even possibly foiling the plan, anti-theft devices can deter potential criminals from trying their hand with your car.
-
Lock your car and close windows completely
This may sound like a no-brainer, but it is worth mentioning. Thieves prioritise easy targets, and a sealed-shut car is not that.
Breaking into a locked vehicle takes expertise and possibly tools. An open one does not.
Simply put, you should not make your car an entry-level target for thieves.
-
Always take your keys with you
An unlocked car with its keys inside is more of an invitation than a challenge for criminals.
Naturally, no one should blame the victim. However, leaving your keys in the car, even for a short time, goes beyond carelessness.
-
Keep valuables out of sight
Stealing a car is frequent in New Zealand, but non-vehicle theft is even more regular.
In 2022 New Zealand faced a staggering 11,066 counts of vehicle theft. In the same period, there were 43,062 non-vehicle theft incidents.
A thief may start with trying to steal your sighted valuables, and their actions will then degenerate into car theft. Stop this criminal snowball by placing your valuables in your trunk or keeping them with you.
-
Keep your handbrake engaged
One way thieves may try to steal your vehicle is by towing it. If your hand brake is down, this will be very easy on them.
The more difficult it will be for them to tow your vehicles, the more attention they will draw to themselves.
Tips
You can also leave your car in first gear when stationed, especially if your handbrake is malfunctioning. Doing this will lock your wheels and make towing unfeasible without a professional vehicle.
-
Mind where you park
You now know that, when concerning the risk of having your car on the stolen vehicles list, NZ is not all the same.
There are certain areas historically linked to criminality. However, even on a non-macroscopic level, you should aim to park your car in well-lit areas. Try to place it where your direct visibility is also guaranteed.
-
Do not buy models without factory-built immobilisers
Inspector and spokesperson for New Zealand police, Trevor Briggs, that the top five models targeted by thieves lack built-in immobilisers.
Try buying a car with sound security systems, or you may risk losing it down the road.
Methodology
When researching real-life issues such as the number and rate of stolen cars in NZ, we attempt to compute and present the current facts objectively and informatively.
For this reason, we follow specific guidelines that guarantee transparency and the quality of our content as a source of relevant data.
-
Use of trusted data
We have analysed the stolen cars’ NZ statistics as they were present in the most recent database provided by official sources.
Our contributors prioritised the figures published by the New Zealand police. All the published observations have been computed based on primary sources.
-
Computing car theft statistics NZ
Our experience with complex and dynamic market sectors provides us with the expertise necessary to make sense of brute data.
We utilise the available figures to create informative content that can educate and aid our New Zealand readers’ day-to-day lives.
-
Stricture and structure
The articles we publish find a middle ground between approachability and comprehensiveness. We aim to provide user-friendly content that adheres to the highest publishing standards.
The published article results from an extensive scrutiny process, verifications, and updating when required.
The objective of our entire approach to the NZ most stolen cars data is to elucidate complex issues and aid our readers in understanding them completely.
References
- New Zealand Police – Crime statistics publications
- EHINZ – Number of motor vehicles
- New Zealand’s top 10 stolen cars – AMI Insurance data
- How NOT to get your car stolen
- Does your car feature on this commonly stolen list? Police issue warning to vehicle owners
- New Zealand – Automotive Sales volume, 2022
- Car Crime: Auckland’s Worst Suburbs
- Opinion: Most stolen car in NZ: I took the risk – and it got nicked
- 18 Things Car Thieves Won’t Tell You
- Owners of 500K sports car threaten legal action against Crown Casino after the parking valet handed over the keys to a thief
- EHINZ – Motor vehicles
F.A.Q.
How often are stolen vehicles recovered?
The average rate of recovery for stolen cars in NZ is 70%. That means that 7 in 10 cars are returned to their owners. However, statistics vary. The Mazda Demio has a 94% recovery rate, with only 1 in 16.667 cars of the model remaining unreturned.
What deters car thieves?
Thieves will not try their hand with a car with built-in security systems, immobilisers, a raised handbrake, windows and doors shut and locked, and no keys or valuables in sight.
What do people do with stolen cars?
The most frequent action taken following carjackings is another crime. Thieves will use stolen vehicles for transportation to another crime.
How do thieves mark cars?
It is true that some criminals will mark vehicles they will attempt to break into. They often only resort to using a marker pen.
Which cars are least likely to be stolen?
New models with extensive security systems are safe from stealing. Additionally, any locked vehicle parked in a personal garage or area with high visibility is safe from stealing.
What do thieves do after stealing a car?
Criminals will often use the car until it runs out of fuel or is turned off and cannot be started without a key.
How do cars get stolen without keys?
Thieves can use signal relaying to exploit keyless entry systems.
How do thieves start a car without keys
Once they managed to enter your car, the perpetrators will attempt to find the wires that start the engine and close the circuit in a similar manner that your key would.